
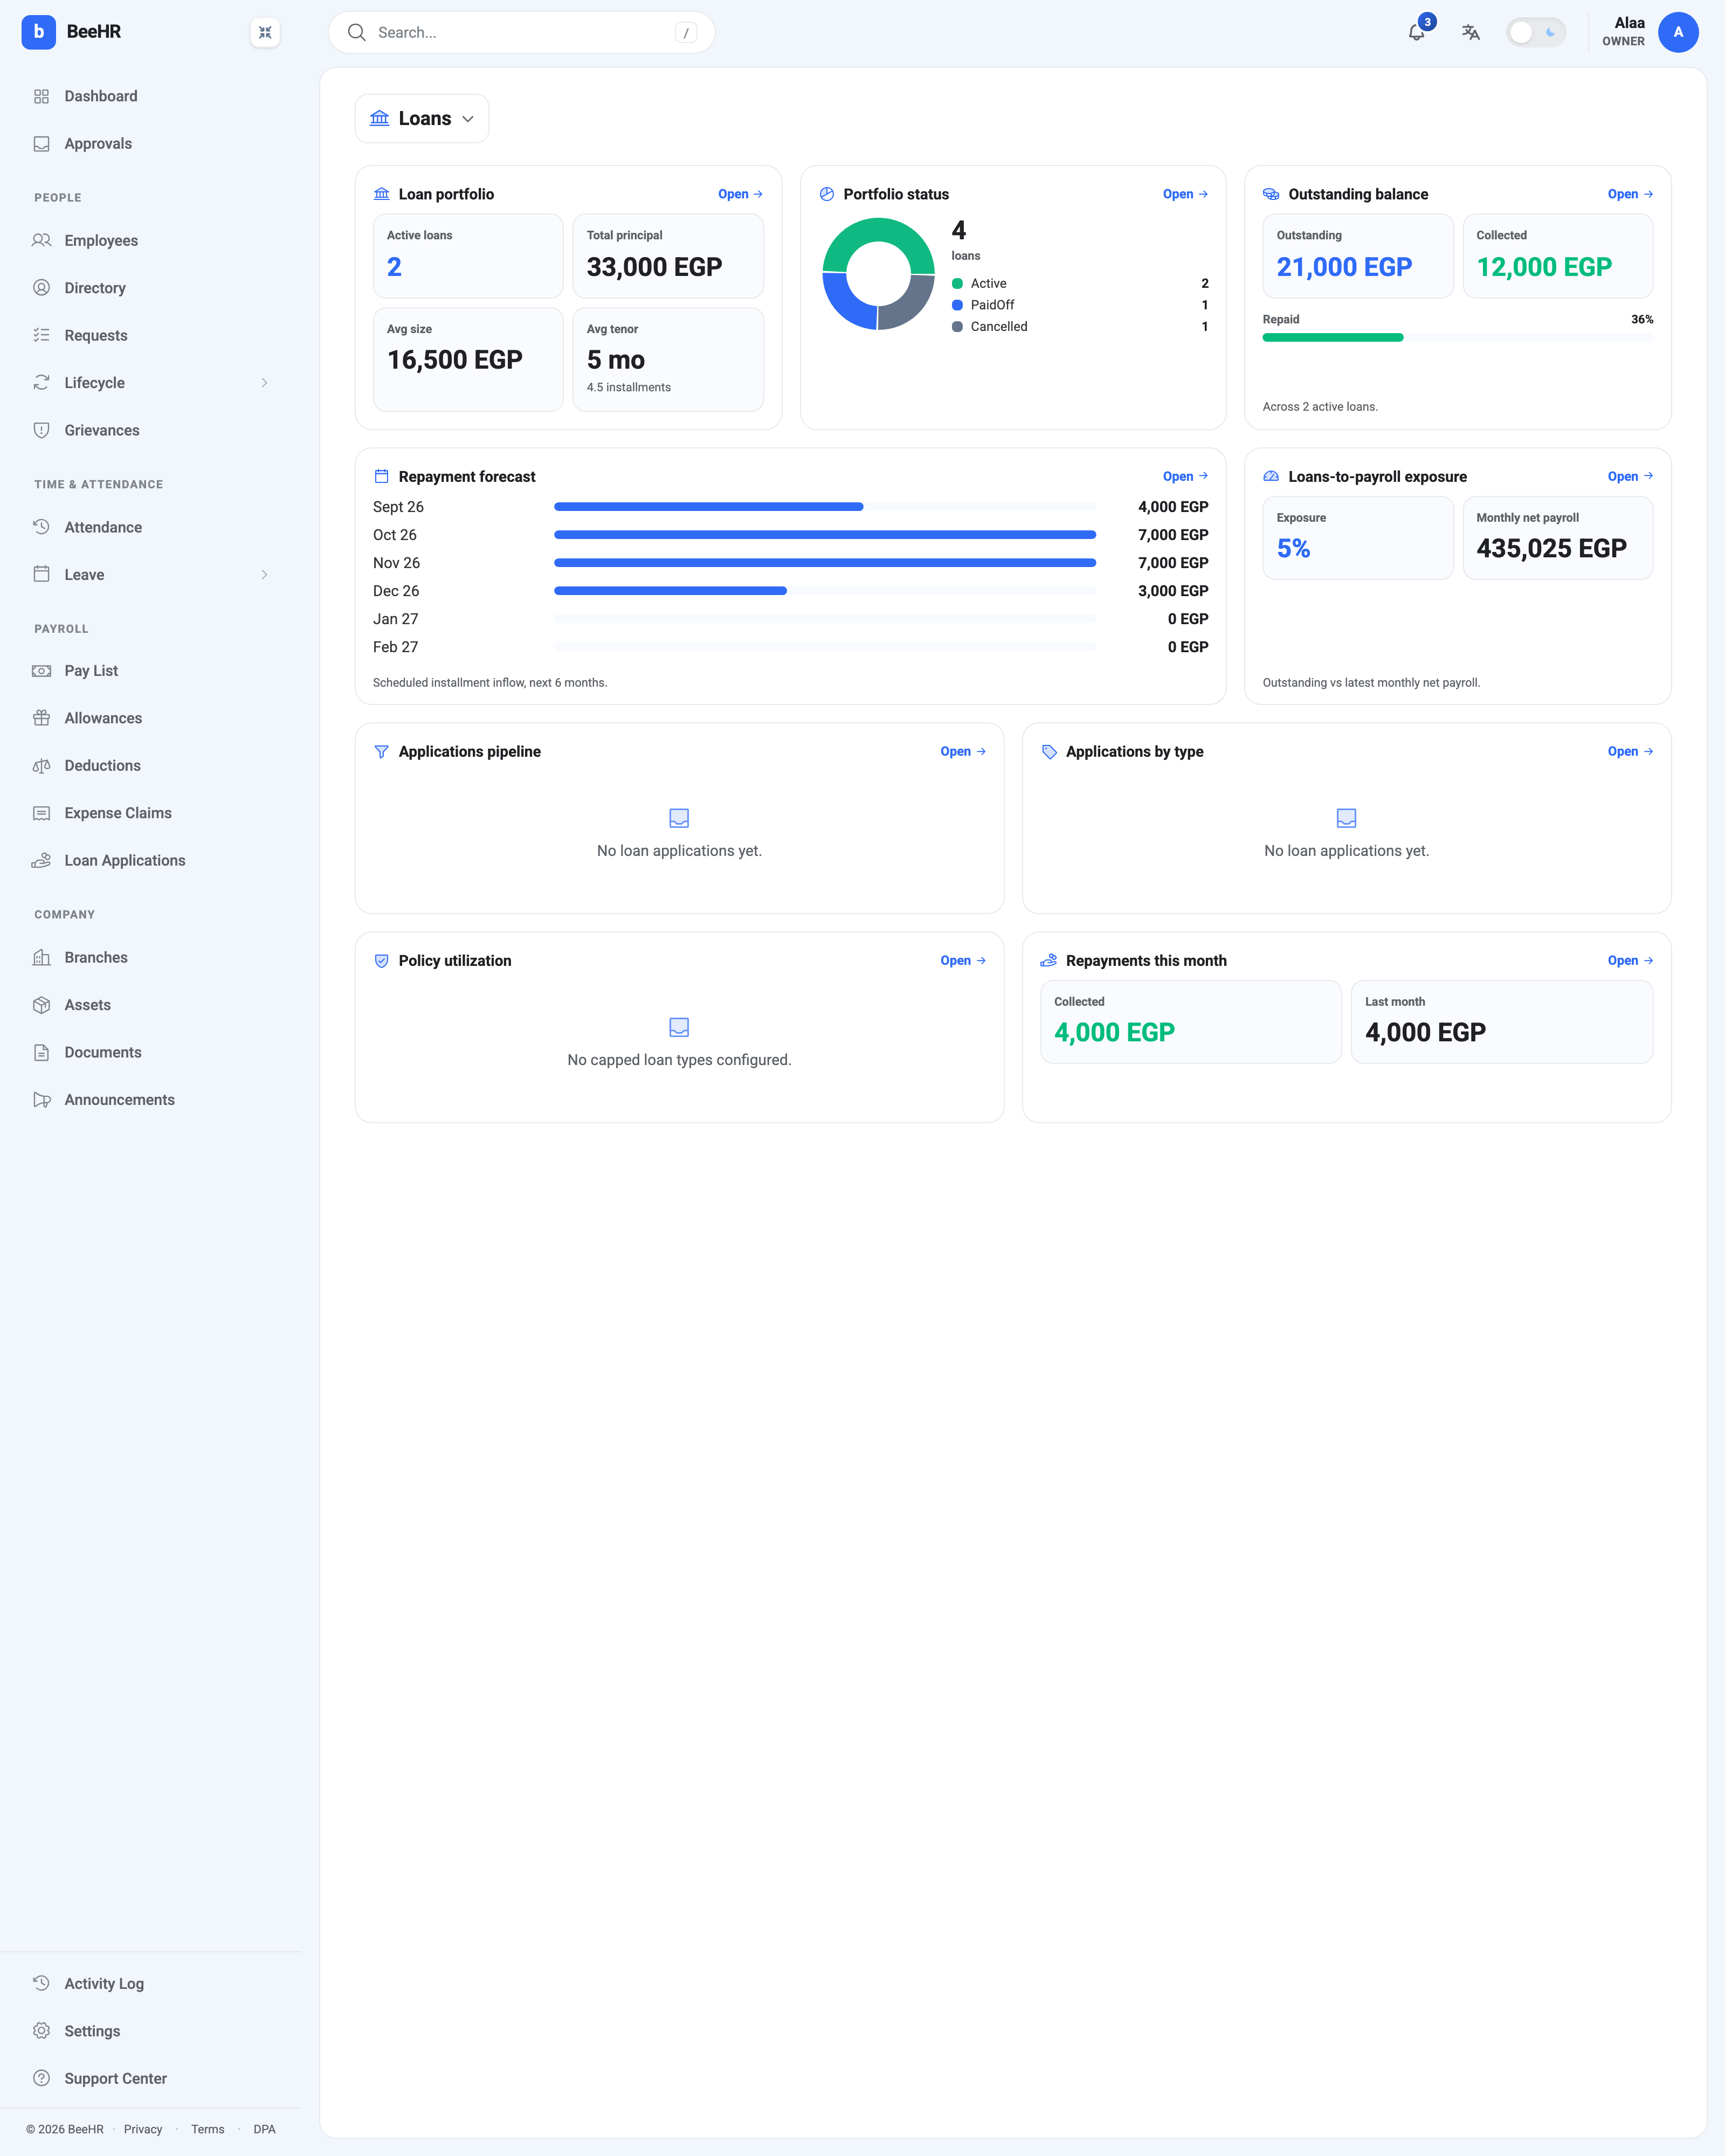
The Loans dashboard answers two questions: what has the company lent, and when is it coming back? Nine widgets, split between the loans you’ve already issued and the applications waiting to become loans.
Portfolio at a glance
Loan portfolio counts only active loans — 2 of them, 33,000 EGP of principal between them, averaging 16,500 over about five months. Settled and cancelled loans are excluded, because the question this card answers is what’s currently outstanding.
Portfolio status counts all loans ever created, by state: Active, PaidOff, Cancelled, Written off. That’s the card to read for history rather than exposure. The two disagreeing is normal and expected — 4 loans total, 2 of them still running.
“Collected” here isn’t the loan’s own figure
This is the one number on the dashboard that will make you stop, and it’s worth understanding rather than working around.
Outstanding balance reads Outstanding 21,000, Collected 12,000, 36% repaid. Open the same loans individually and their balances add up differently — one of them reports 16,000 repaid on its own record.
Both are correct, because they count different things:
- The loan record counts every installment with a status of Approved, whenever it falls. Approve October’s installment today and the loan immediately calls it repaid.
- This dashboard counts installments in months that have actually passed. A future-dated installment, even an approved one, is treated as forecast rather than collected.
So the dashboard is the more conservative view, and it’s the right one for “how much money has actually come back”. The loan record is the right one for “how much of this agreement is settled”. Loans and Installment Deductions explains the approval-based definition.
The repayment forecast
Scheduled installment inflow for the next six months, one bar per month. It’s built from the installment rows that exist, so it only knows about loans already created — it is a schedule, not a projection.
Two things it tells you at a glance: when the money lands, and when the book empties. The zero months at the end of the run are when the current loans finish; if they’re the last thing on the book, that’s the point where repayments stop contributing to cash flow.
The forecast counts installments regardless of whether they’ve been approved yet, because an unapproved installment is still scheduled. That’s the opposite convention to the Collected figure above, and it’s the right one for a forecast — just don’t read the two as the same measure.
Exposure
Loans-to-payroll exposure divides what’s outstanding by monthly net payroll — 5% here. It’s the closest thing to a risk number on the screen: the share of a month’s wage bill the company is currently owed by its own staff.
The caption says outstanding vs latest monthly net payroll, and “latest” means the most recent run in the account whatever its status — including a cancelled one. Same caveat as on The Payroll Dashboard: check which month the figure came from before quoting the percentage.
Repayments this month compares what’s been collected against last month, which is the quickest check that recoveries are actually happening rather than accumulating as unapproved installments.
The applications half
Applications pipeline, Applications by type and Policy utilization read the Loan Applications module — the request-and-approve flow where an employee asks for a loan — rather than the loans on the deductions side. The two are separate records, so a company that records loans directly will see this half stay empty.
No capped loan types configured on Policy utilization is a different kind of empty: it means no limits have been set in Loan Policy, so there’s no cap for utilisation to be measured against.
Reading it well
Before lending anything else, the three cards worth a look are Outstanding balance (what’s already out), Exposure (whether that’s a lot), and the Repayment forecast (whether the existing book is clearing). Everything else is history.