
The Workforce dashboard answers one question ten ways: who works here? It’s the only dashboard fed entirely by employee records, so it has something to show from the day your roster is loaded — no payroll, attendance or lifecycle data required.
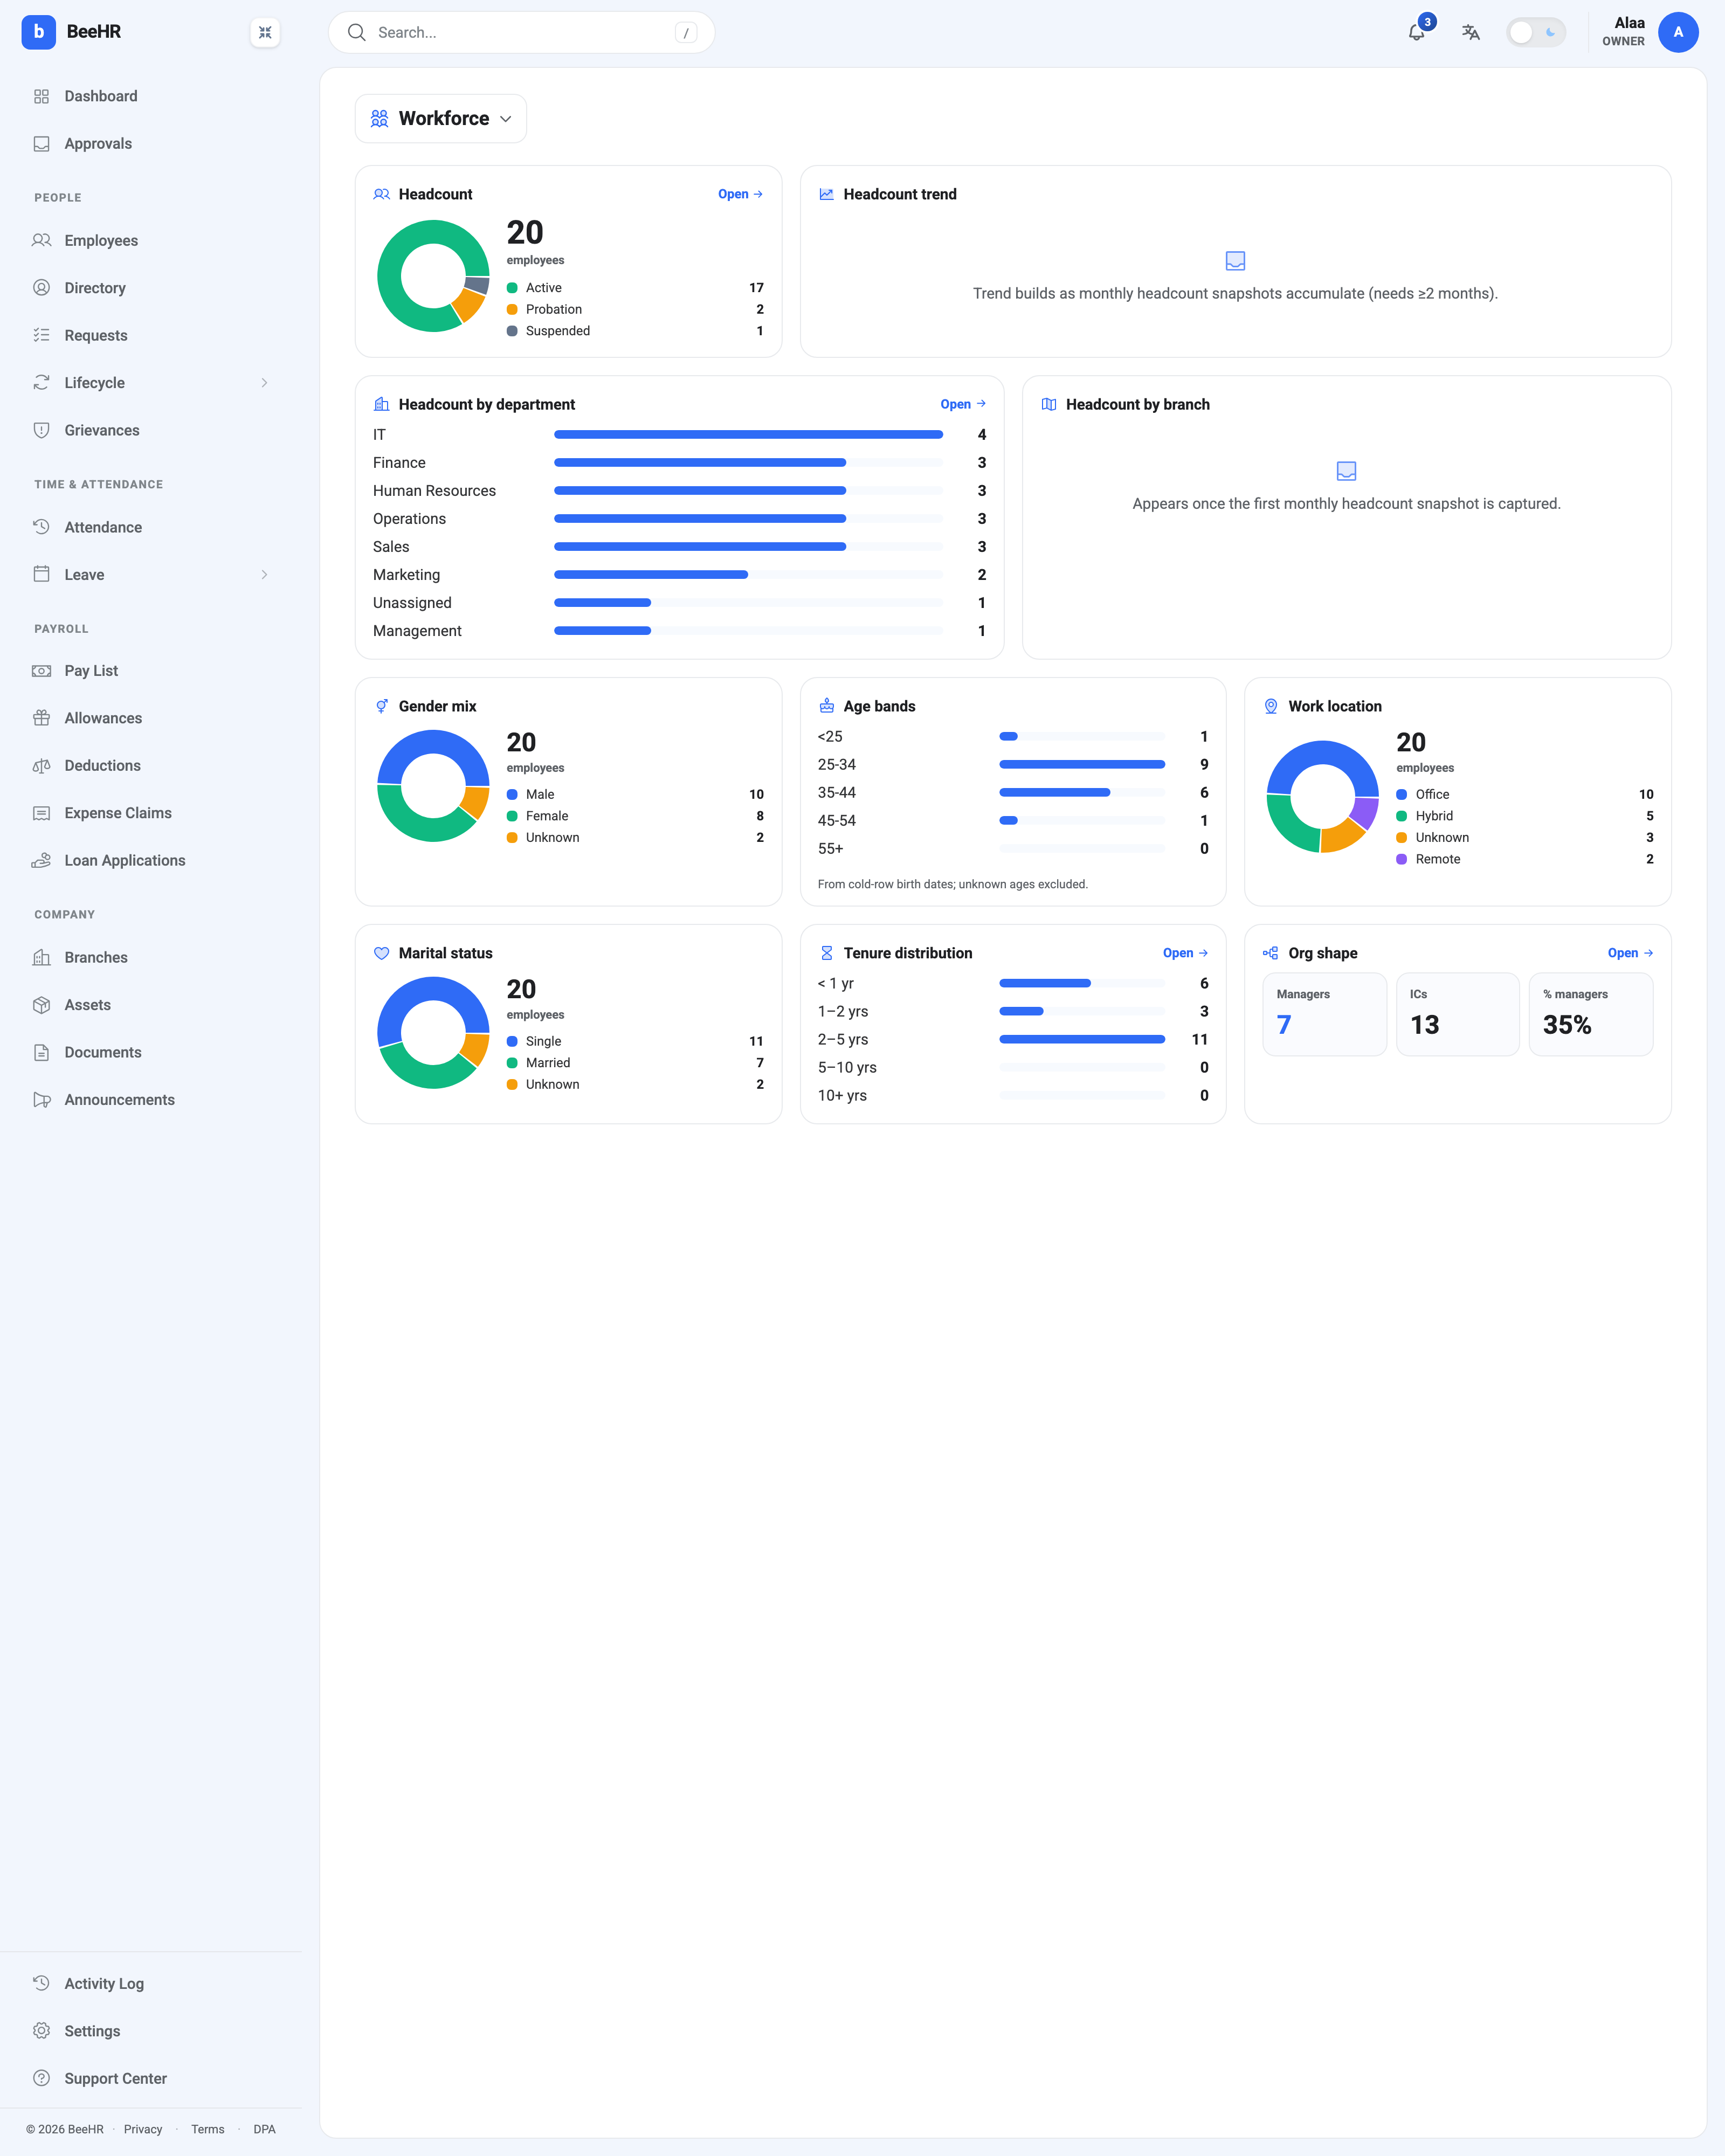
Two cards that need months, not records
Headcount trend and Headcount by branch are blank on a new account, and both explain themselves rather than looking broken:
Trend builds as monthly headcount snapshots accumulate (needs ≥2 months).
Appears once the first monthly headcount snapshot is captured.
BeeHR takes a headcount snapshot once a month. Anything comparing months has nothing to compare until at least two exist, so a new account waits — there’s no setting to switch on and no backfill. Two months in, both fill themselves.
Worth knowing so nobody spends an afternoon looking for the configuration that would fix it.
Where “Unknown” comes from
Three cards carry an Unknown slice — gender, work location, marital status — and one has a footnote about it: from cold-row birth dates; unknown ages excluded.
Unknown means the field is empty on that person’s record, not that somebody declined to answer. Two Unknowns out of twenty is a roster that was imported quickly; the fix is the employee record, not this screen. If a demographic breakdown is going to inform a real decision, it’s worth clearing the Unknowns first — see Editing an Employee’s Details.
The age card is stricter: people without a birth date are excluded from the band totals rather than shown as unknown, so its total can be lower than your headcount. Don’t read the bands as a percentage of the company unless you know every birth date is set.
Headcount and its statuses
The Headcount donut splits by employment status — Active, Probation, Suspended — and counts everyone on the books. It’s the number to reconcile against when another screen shows fewer people: 20 here against 15 in a pay run is normal, and How Payroll Works explains which five weren’t payable.
Headcount by department is a bar per department, and Unassigned is a real row. One person with no department is easy to miss on the employees list and obvious here, which makes this card a decent data-quality check.
Org shape and span of control
Org shape counts Managers against ICs (individual contributors) and gives the ratio — 7 managers over 13 ICs, 35%.
A manager here is anybody who has at least one person naming them as reporting manager. That’s a structural fact, not a job title: somebody titled Manager with no reports counts as an IC, and a senior engineer with two juniors reporting to them counts as a manager. The designation catalogue has no bearing on it — see Designations.
A high manager percentage on a small team usually means the reporting lines were set sparsely rather than that the company is top-heavy. It’s worth checking before drawing a conclusion, because reporting lines also drive who approves requests and what a Direct-reports scope can see.
Tenure
Tenure distribution bands people by time served, counted from their joining date. It’s the quickest read on whether a company is young, stable or churning: 6 under a year against 11 in the two-to-five band is a business that grew in two waves.
The same card appears on the Lifecycle dashboard, where it sits next to attrition and answers a different question — there it’s about who’s at risk of leaving, here it’s about who you have.
What this dashboard is not
It has no filters and no date range. Everything is now, for the whole organization within your data scope. To slice by department or branch, use the filters on the employees list and export from there.
Open → on any card goes to the records behind the number.